Spectroelectrochemical Cell SEC-C
Spectroelectrochemistry (SEC) is aimed at the investigation of electrochemical reaction mechanism and the interface structure between electrolyte solution and electrode. Remarkable progress in this field and related technology enables SEC to be applied in wide areas.
Nowadays, the relation between absorbance and potential for reversible or quasi-reversible system is theoretically elucidated, on which basis the analysis of electrochemical characteristics becomes possible for the system otherwise difficult with only the result of voltammogram. Typical example is redox/ima enzyme cytochrome c and methylene blue.
Applications:
- Real time monitoring of chromatic change by redox reaction
- Analysis of the charge transfer at the electrode/liquid interface
- Spectrometric measurement of near/surface of electrodes
- Absorbing spectrum of the product and intermediate
- Parameters: concentration, diffusion coefficient and life time
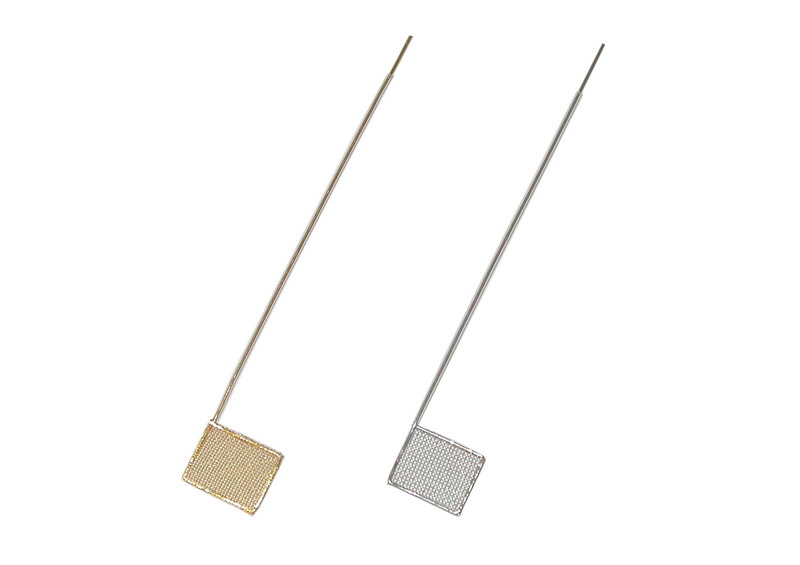
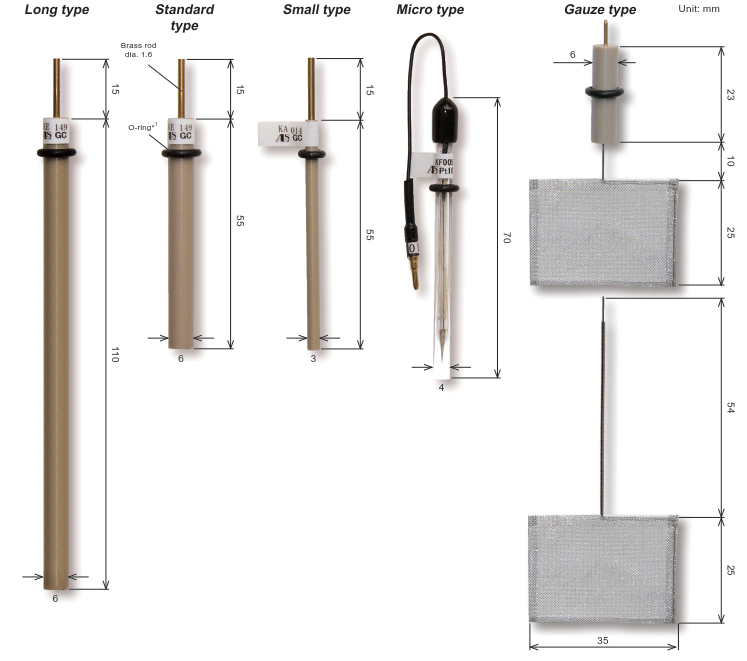
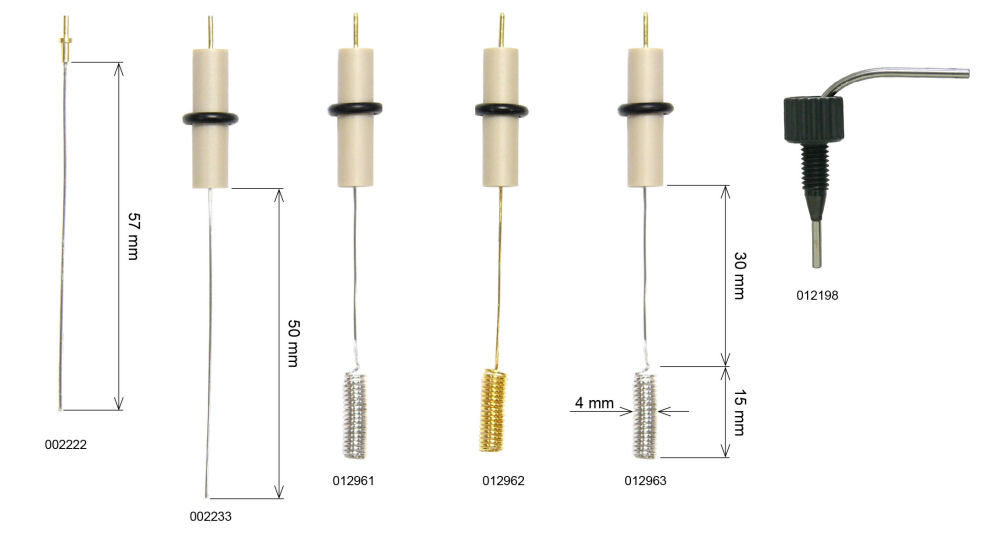
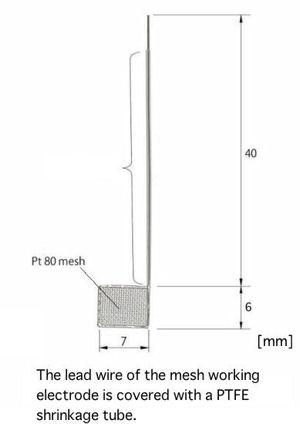
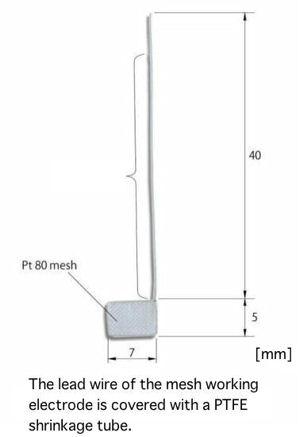
Working Electrodes for SEC-C
Working Electrodes can be chosen optionally from below:
| Catalog No. | Description |
ALS 012017 | SEC-C Au Gauze working electrode |
ALS 011498 | SEC-C Pt Gauze working electrode |
ALS 012607 | SEC-C05 Au Gauze working electrode |
ALS 012606 | SEC-C05 Pt Gauze working electrode |
Two variety optical path length (0.5 and 1.0 mm)
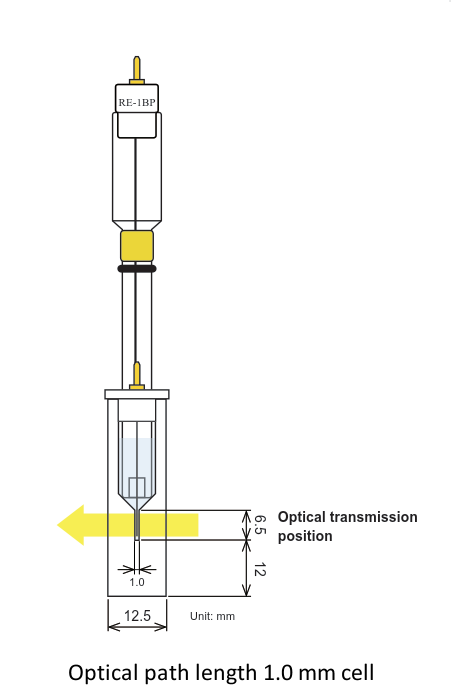
The optical path length 1.0 mm is most suitable for basic spectrum electrochemistry measurements. Theoretically, it is possible to get the same result as for 0.5 mm with a half concentration sample.
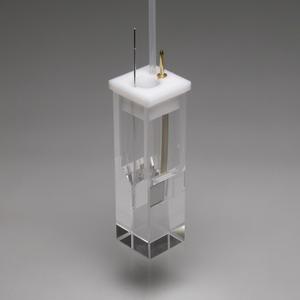
SEC-C 1.0mm cell content
ALS 013716 | SEC-CT Thin Layer Quartz Glass Spectroelectrochemical cell Kit (Pt) |
ALS 013717 | SEC-CT Thin Layer Quartz Glass Spectroelectrochemical cell Kit (Au) |
ALS 013703 | SEC-C/C05 Pt counter electrode |
ALS 013718 | SEC-CT Thin Layer Quartz Glass cell |
ALS 011501 | SEC-C Teflon Cap |
ALS 010537 | Purging tube 10 cm |
ALS 011498 | SEC-C Pt Gauze working electrode |
ALS 012017 | SEC-C Au Gauze working electrode |
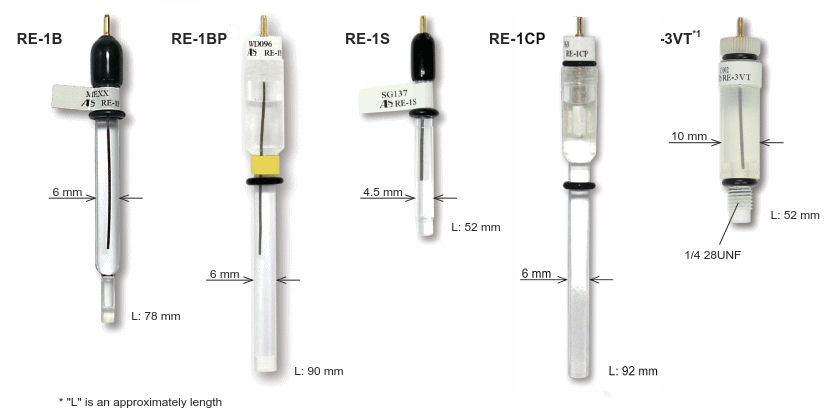
ALS 012167 | RE-1B Reference electrode (Ag/AgCl) |
ALS 012017 | RE-1BP Reference electrode (Ag/AgCl) |
ALS 013848 | RE-7N Non Aqueous reference electrode |
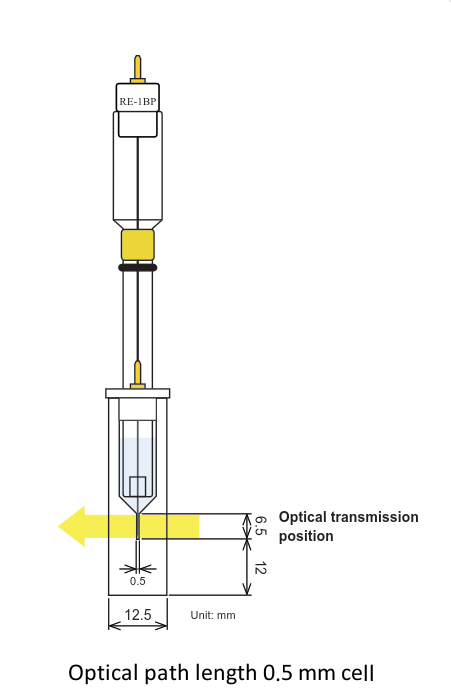
The optical path length 0.5 mm has an electrolysis time shorter than 1.0 mm cell. The stability short time for the electrolysis makes possible to have a stable result as for, measurement of the high volatile organic solvent, detection of the unstable electrolysis products, and others.
* There is a specific working electrode for 0.5 mm optical path length. The working electrode for 1.0 mm optical path length can not be used in 0.5 mm optical path length quartz cell.
SEC-C 0.5mm cell content
ALS 013700 | SEC-C05T Thin Layer Quartz Glass Spectroelectrochemical cell Kit (Pt) |
ALS 013701 | SEC-C05T Thin Layer Quartz Glass Spectroelectrochemical cell Kit (Au) |
ALS 013703 | SEC-C/C05 Pt counter electrode |
ALS 013702 | SEC-C05T Thin Layer Quartz Glass cell |
ALS 011501 | SEC-C Teflon Cap |
ALS 010537 | Purging tube 10 cm |
ALS 012606 | SEC-C05 Pt Gauze working electrode |
ALS 012607 | SEC-C05 Au Gauze working electrode |
ALS 012167 | RE-1B Reference electrode (Ag/AgCl) |
ALS 012017 | RE-1BP Reference electrode (Ag/AgCl) |
ALS 013848 | RE-7N Non Aqueous reference electrode |
Comparison of 0.5 and 1.0 optical path length cell
The electrolysis stabilization time for the 0.5 mm optical path length cell is theoretically a half, compared with the 1.0 mm cell. It is the opposite, for the concentration, when the same result for the 1.0 mm cell is possible for a half of the concentration compared with the 0.5 mm cell. You could select the optical path length and the working electrode appropriate for your research purpose.
| Optical path length | Merit | Demerit |
| 0.5 mm | High electrolytic speed | Difficult maintenance |
| 1.0 mm | Easy maintenance | Slow electrolytic speed |
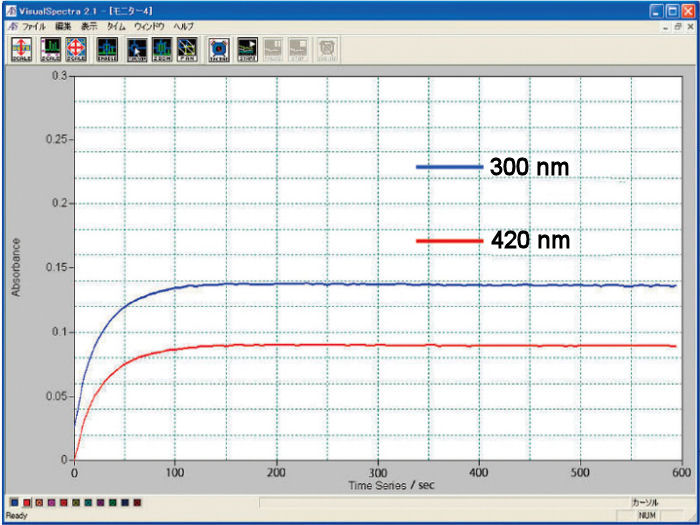
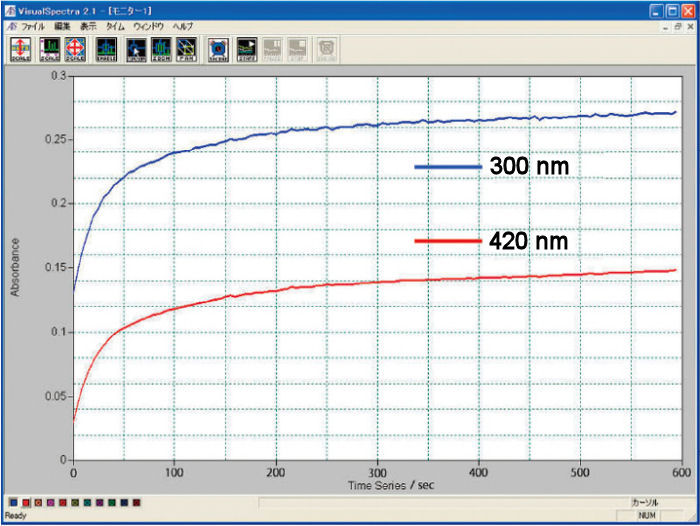
Comparison of the electrolysis reaction equilibrium time
For the comparison of the 0.5 and 1.0 optical path length cells, there is a difference between the theoretical and experimental values. It is in consequence of the experimental conditions.
A 2 mM potassium ferrocyanide (K4[Fe(CN)6]) was subjected to an electrolysis reaction at 0.6 V until its stability, and 1 M KNO3 was used as a reference. The oxidation reaction was monitored by the comparison of the absorbance in function of the time at wavelengths of 420 and 300 nm.
Measurement example using cuvette type spectroelectrochemical cell
UV-visible absorption spectrum and absorbance of the product of the electrode reaction, performed with optically transparent electrode (OTE), were measured. Gold or Platinum mesh electrode was used as an OTE. Cyclic voltammetry and Absorbance of the 2 mM potassium ferricyanide, as the reference of the absorbance, performed in a SEC-C Thin Layer Quartz Glass Spectroelectrochemical cell are shown below.


Simultaneous measurements of the cyclic voltammetry and absorbance as well a constant potential electrolysis measurement were also performed. The electrolysis, reduction (Figure 3-1) and oxidation (Figure 3-2), of the potassium ferrocyanide solution are shown below.