NIR Analysis in Food Industry
Near-Infrared (NIR) Spectroscopy is a powerful, non-destructive analytical technique that measures how a sample interacts with NIR light. This technique is widely used in the food industry for quality control and authentication because different materials absorb and scatter NIR light in unique ways, resulting in distinct spectral fingerprints.
The continuous advancements in NIR Spectroscopy enable us to provide a comprehensive range of NIR Solutions. These include Handheld devices, Portable and Mini NIR spectrometers, as well as Hyperspectral Cameras for NIR analysis. These versatile tools can be utilized for a wide range of applications in both industrial and research settings. Spectrify streamlines data analysis by simplifying the process of preparing and comparing data.
Classifications with Coffee Data
A specific application of NIR Solutions is the
classification of coffee brands utilizing Principal Component Analysis
(PCA) and spectral databases. PCA is a powerful multivariate statistical
technique that reduces the dimensionality of complex datasets while
preserving the maximum amount of variance. This means that complex data,
such as spectra, can be summarized, allowing an easy understanding of
intrinsic differences between data. By applying PCA to NIR spectral data, we can
identify the most significant sources of variation among different
coffee brands.
Using the database created by our colleage Daniel Pelliccia from NIRPY Research, you can implement a PCA Classification model,
where different brands will be distinguished based on how
similar or different their coffee spectra are. Follow this tutorial and
learn how to apply these concepts using Spectrify.
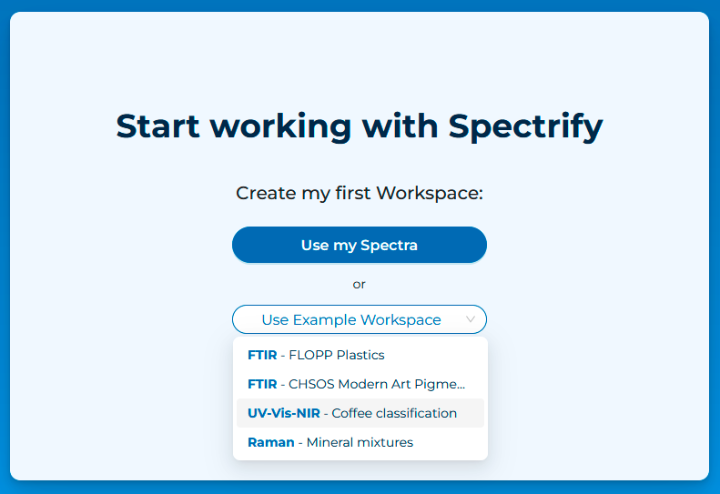
Spectrify currently has as an example workspace the Coffee Brands Dataset preloaded. Just select it in the drop down menu.
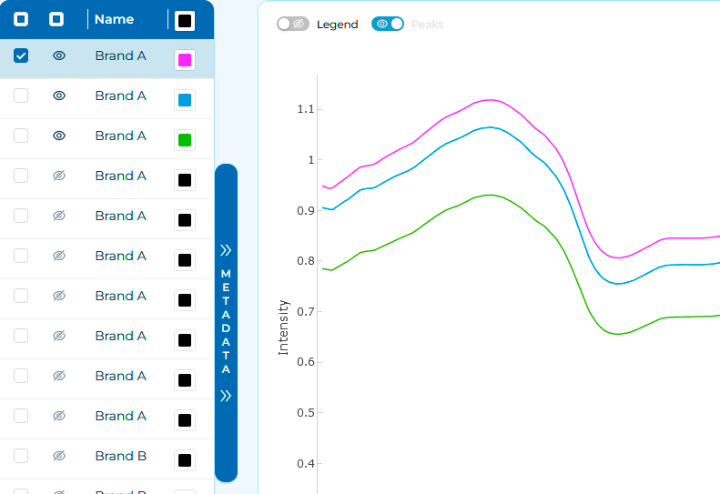
You will access the Workspace. In the Spectra Table, you
can select different spectra for editing and/or visualization.
Additionally, you can choose a distinctive color for each spectrum.
When working with real-world data, preprocessing is a
necessary step in spectral analysis. Spectrify offers a wide variety of
preprocessing options. You can access them through the Preprocessing
tab. For more information, visit our Docs site.
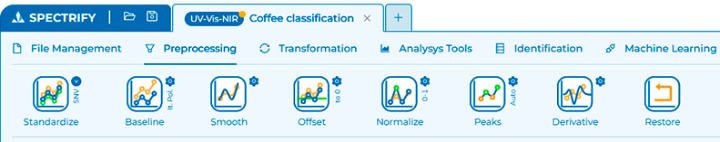
For this tutorial, we are going to implement a chain of different preprocessing steps. Remember to visit our Docs site for detailed explanaitons of each one.
- Select edit mode for all spectra (first check-case in the Spectra Table)
- Then, let's apply Standardize, Baseline, Smooth, Normalize, and Derivative, in this order and with default settings. Just clicking the icons.
- If you have some spectra selected for visualization, you will see them changing in real-time.
Finished this process, you will see something like this.
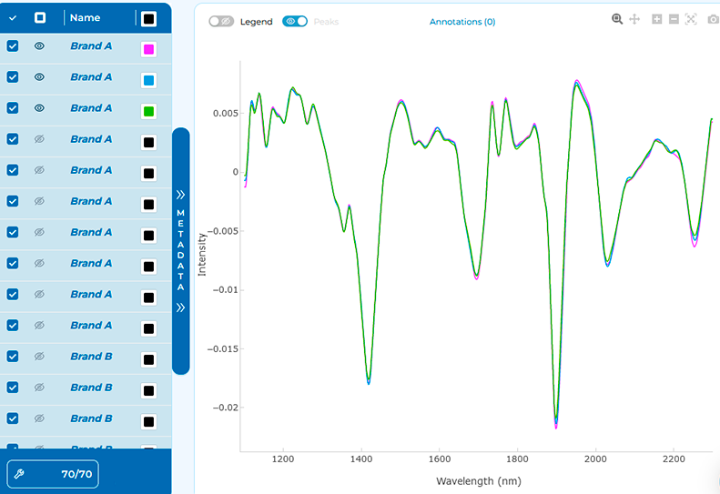
The change of font in the Spectra Table names indicates that changes have been made to the spectra. At any time, you can recover the original spectra with the Restore Button.
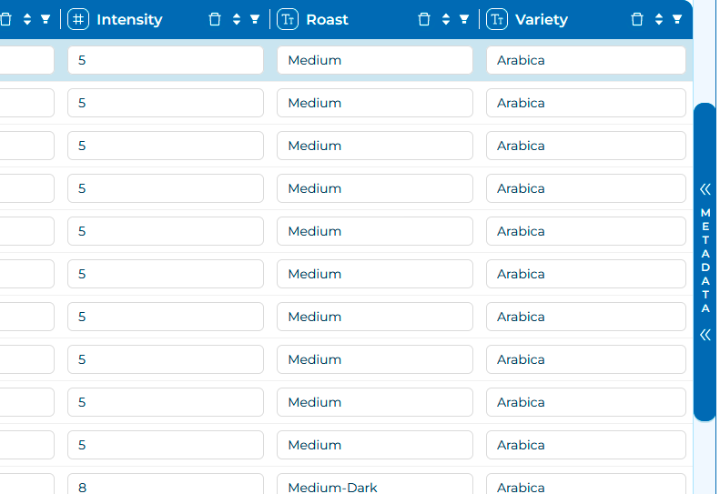
Additionally, you can explore the metadata associated
with each spectrum by expanding the metadata button, located beside the
Spectra Table.
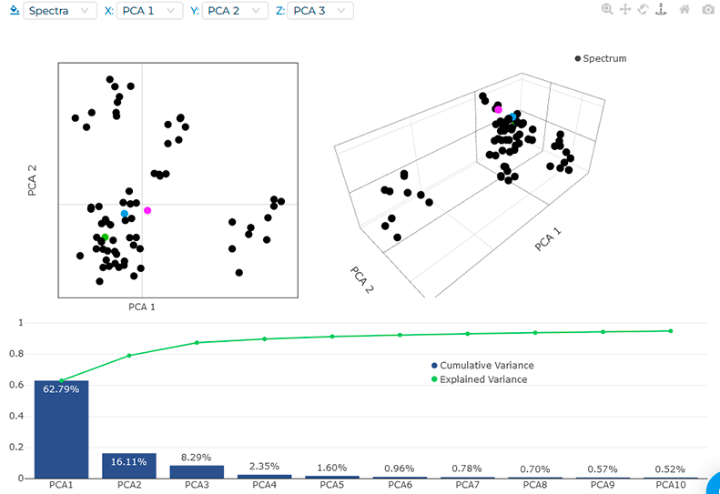
Let's move into Machine Learning tab. With all spectra selected for editing, click on PCA icon... and the analysis will be done
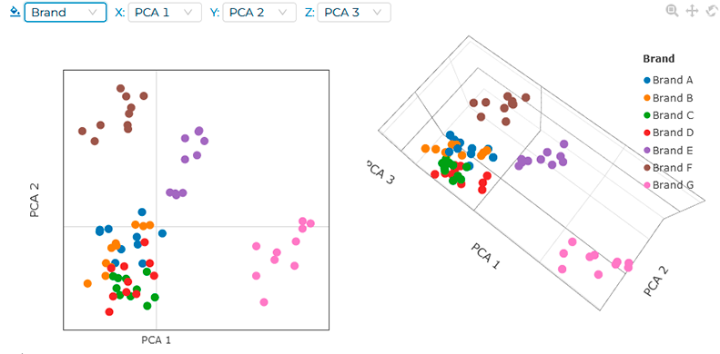
If you select the metadata "brand" in the graph area
drop-down menu, you will see some interesting insights. For example,
brands E, F, and G are very distinctive, while the rest are quite
similar. This observation could be very important if, for example, the
prices vary hugely among spectrally-similar brands, as they are
essentially the same.
Original Idea: Daniel Pelliccia https://nirpyresearch.com/analysis-ground-coffee-nir-spectroscopy/
Cover image: https://www.vecteezy.com/free-photos