Did you know that you can identify the geographical origin of your olive oil simply by analyzing its chemical fingerprint? Thanks to FTIR spectroscopy and chemometric techniques, such as Principal Component Analysis (PCA), it is possible to differentiate olive oils from different regions. And Spectrify makes it easy.
FTIR Spectroscopy
Fourier Transform Infrared Spectroscopy (FTIR) is an analytical technique that measures how a sample absorbs different wavelengths of the mid-infrared, frequencies that we associate with heat. Unlike near-infrared, this technique allows chemical bonds to be easily identified, and is capable of measuring a large amount of data in a very short time.
It is widely used in a large number of disciplines such as the food industry, medicine, archaeology... due to its speed and reliability for both identification and quantification of components. At SFTec, we facilitate data acquisition through our consulting service and with our FTIR equipment.
Don't hesitate to ask us!
Identifying the origin of olive oil
A highly interesting case study is the determination of the geographical origin of olive oil using FTIR data. By applying chemometric techniques such as Principal Component Analysis (PCA) we can identify the most significant sources of variation between olive oils from different regions.
Henri S. Tapp's team analyzed 52 samples of olive oil from Spain, Greece and Italy, and managed to relate its chemical fingerprint to the country of origin, obtaining excellent results. With Spectrify we can perform the same analysis in a simple way.
PCA analysis of olive oils origins

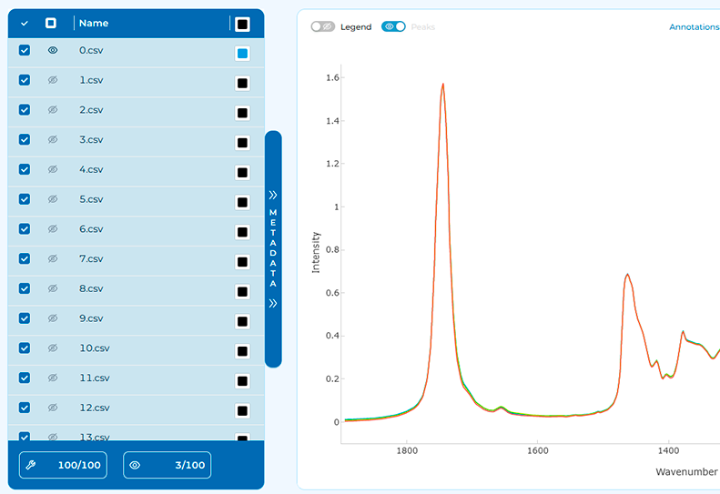
The complete Workspace will appear, with all the spectra selected for editing, but only 3 marked for viewing. One from each geographical area.
This informations is displayed below the Spectra Table.
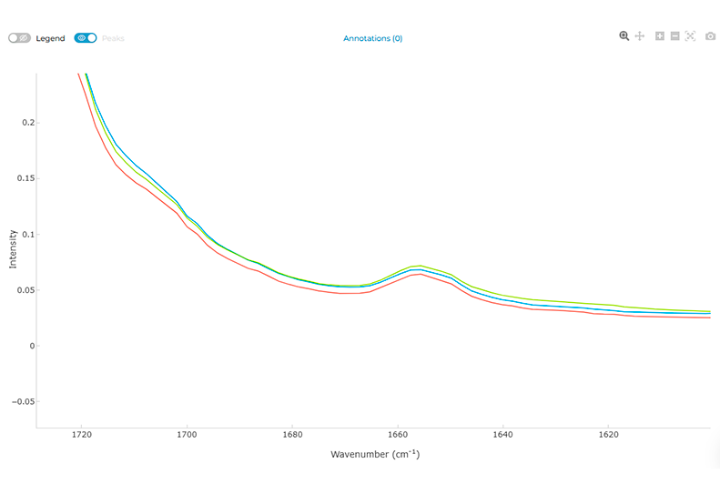
By zooming in we can see a certain trend around 1720-1660 cm-1, where the spectra of the different countries show different heights.
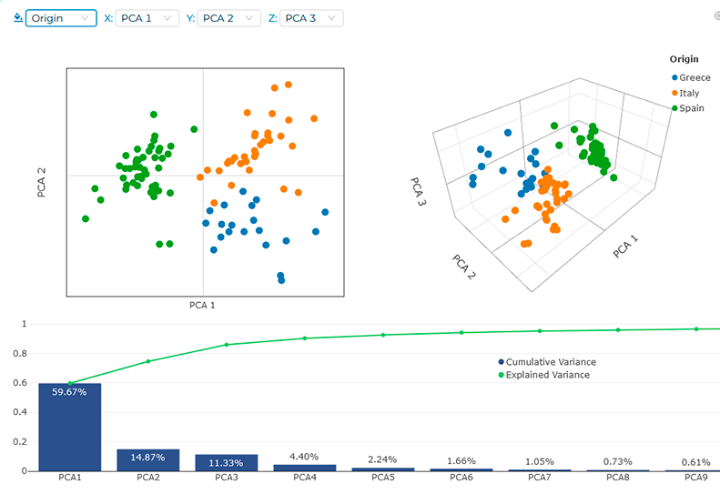
But how can we facilitate this interpretation? Thanks to PCA, you can summarize each of these spectrums in just one point. In the Machine Learning tab, you will find the data for this analysis preloaded. By selecting "Origin" from the drop-down menu, you will be able to visualize how the spectra create distinct groups.
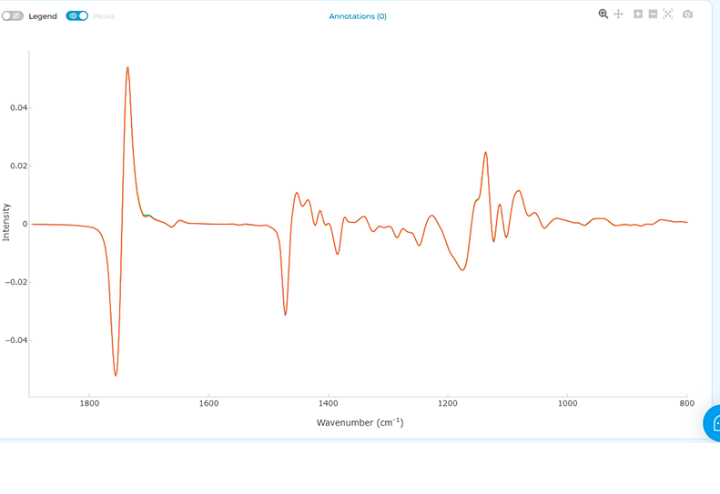
To further optimize this differentiation, you can perform a Preprocessing workflow. To do this, in the preprocessing tab we can create a workflow of SNV, Smooth, Normalize and Derivative with default values (just by clicking).
Back in the Machine Learning tab, click the “PCA” button to update the data and train a Principal Component Analysis model.
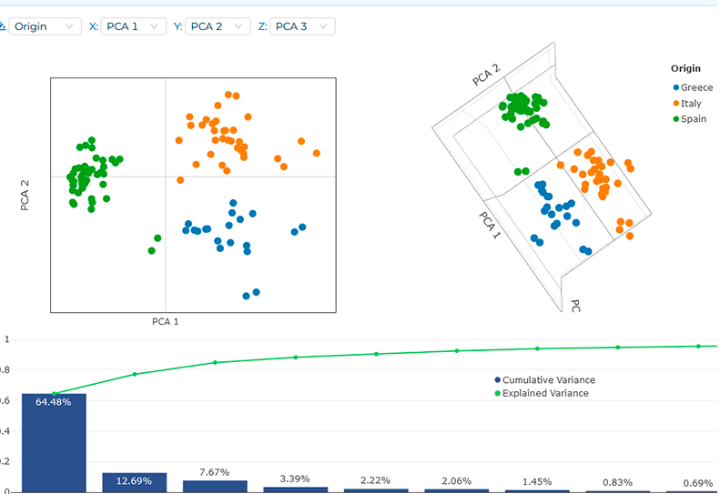
The location of the points in space will allow you to designate areas that define an oil source. Soon, Spectrify will have a prediction option, with which you can use these graphs to investigate where an unknown oil is coming from.
Are you ready to discover the secrets hidden in your olive oil?
Data repository: Quadram Institute: https://csr.quadram.ac.uk/example-datasets-for-download/
Original Idea: Tapp H.S. et al, J. Agric. Food Chem. 51 (21) 6110-5 (2003) https://doi.org/10.1021/jf030232s
Cover image: https://www.vecteezy.com/free-photos
Empiece a escribir aquí...