IviumSoft
Boosting Productivity in Electrochemical Research
Improve your efficiency
IviumSoft is designed for the electrochemist and features all standard electrochemical and corrosion techniques. These include sweep techniques (LSV, CV), transient techniques (CA, CP), corrosion techniques (Eoc, polarization, Tafel plot, galvanic corrosion), electroanalysis techniques (SWV, DPV, AC voltammetry, AC detection, pulse builder) and impedance (E and I controlled, and potential/current scan).
IviumSoft Advanced Features:
- Additional Functions in Advanced Mode: Allows electrochemistry experts to fully control the instrument.
- Abundant Data Analysis Tools: Includes peak finding, curve fitting, corrosion rate analysis, solar cell reporting and equivalent circuit evaluation.
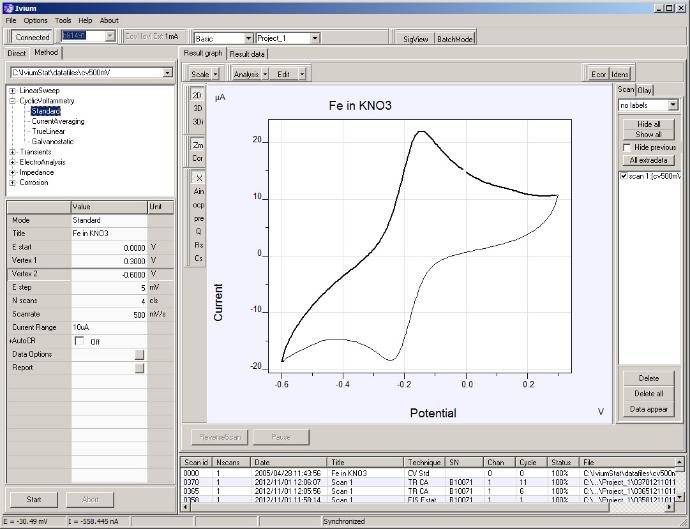
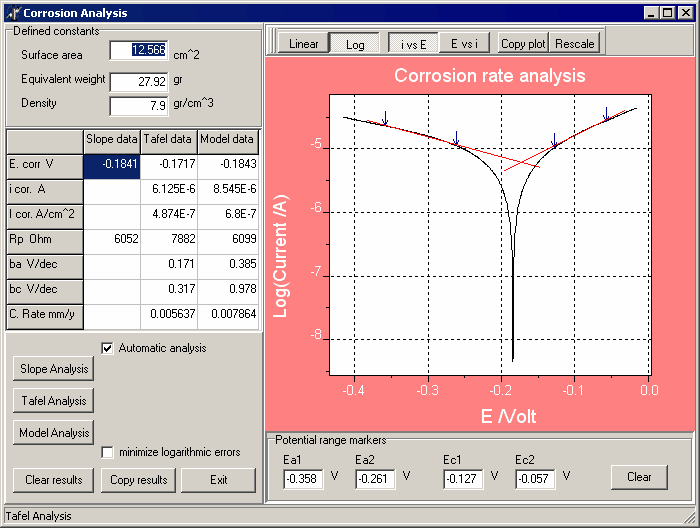
Corrosion rate analysis from Tafel plot experiment
3 analysis types are provided:
- Slope analysis: Ecorr and Rp are determined from slope at OCP
- Tafel analysis: the Tafel lines are constructed and its slopes evaluated
- Numerical analysis: non-linear fit on complete dataset
Automatic or manual analysis:
- Automatic analysis: software will select potential range automatically
- Manual analysis: operator can set potential range markers by mouse click
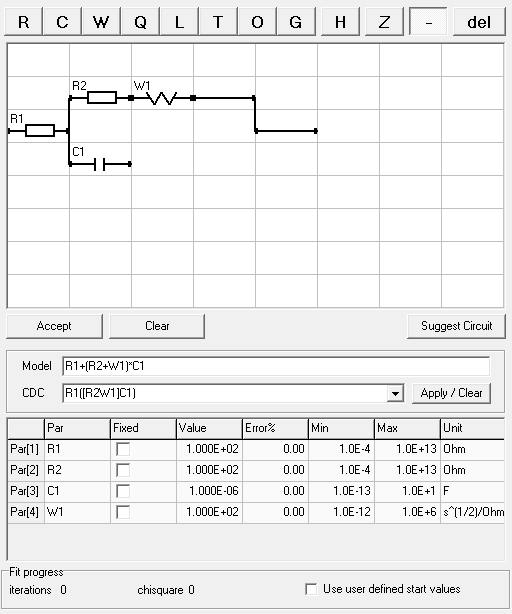
Graphical equivalent circuit editor for fitting impedance data
IviumSoft includes a graphical equivalente circuit editor for fitting impedance data.
- Operator can define any equivalent circuit:
- Any element from the top-toolbar can be selected, and be dropped on the circuit grid, by a single mouse click on the desired location
- Or, a CDC equation can be entered either manually or from the redefined circuits in the drop-down list
- Or, loaded from file
- Start values may be entered by the operator or will be calculated automatically
- Fit-parameters may optionally be fixed
- The software will calculate the best fitting set of parameters with the Levenberg-Marquardt technique
Many special functions are available in IviumSoft and include:
Automatic current ranging
When desired, the user can instruct the potentiostat to automatically select the optimal current range setting. For this functionality all current ranges are available, including the hi-sensitivity current ranges.
Analog inputs
The available analog inputs from the peripheral port may be recorded simultaneously with the primary results. The results are visualized graphically, and stored with the primary data
Apply wrt OCP
The measurement potentials are defined relative to “Open Cell Potential”. Before the measurement starts, the OCP is determined in a zero-current configuration.
Pulse generator
A continuously repeating pulse can be applied to the cell with variable period and duty cycle; intended as a tool to treat the electrode without data being measured
Signal view
The current and potential transients are shown in an oscilloscope type screen. Under dc-conditions, the E/I signals can be inspected for the presence of specific noise elements. During ac-techniques, the quality of the perturbing and resulting sine-waves is visualized. For each data point these traces are stored with the primary data and can be (re)viewed after completion of the experiment
Pretreatment
Up to 5 levels may be defined to condition the electrode before the actual measurement starts. The E/I values during “Pretreatment” are recorded and stored with the primary data.
Ohmic drop compensation
Manual or automatic Ohmic drop compensation
Current interrupt
Direct method that allows the user to determine the IR-drop of the electrochemical system via the current interrupt method (can only be used when Current Interrupt Module is available)
Batch Mode
Batch mode is available within IviumSoft and facilitates the creation of sequences and automation.
Using BatchMode, the operator can automate complex measurement sequences, and interface to external equipment for process automation. It is possible to:
- Automate loading and execution of method files
- Create loops for repetitive tasks, loops may be nested
- Modify selected parameters at each pass inside a loop
- Switch the multiplexer to fixed channels or to the loop index variable
- Set the digital and analog outputs
- Wait for a HI or LO level on the digital input
- Set delays and schedule tasks
Once the complex sequence is created, it is stored in one convenient method file which can be saved and easily loaded at a later date.

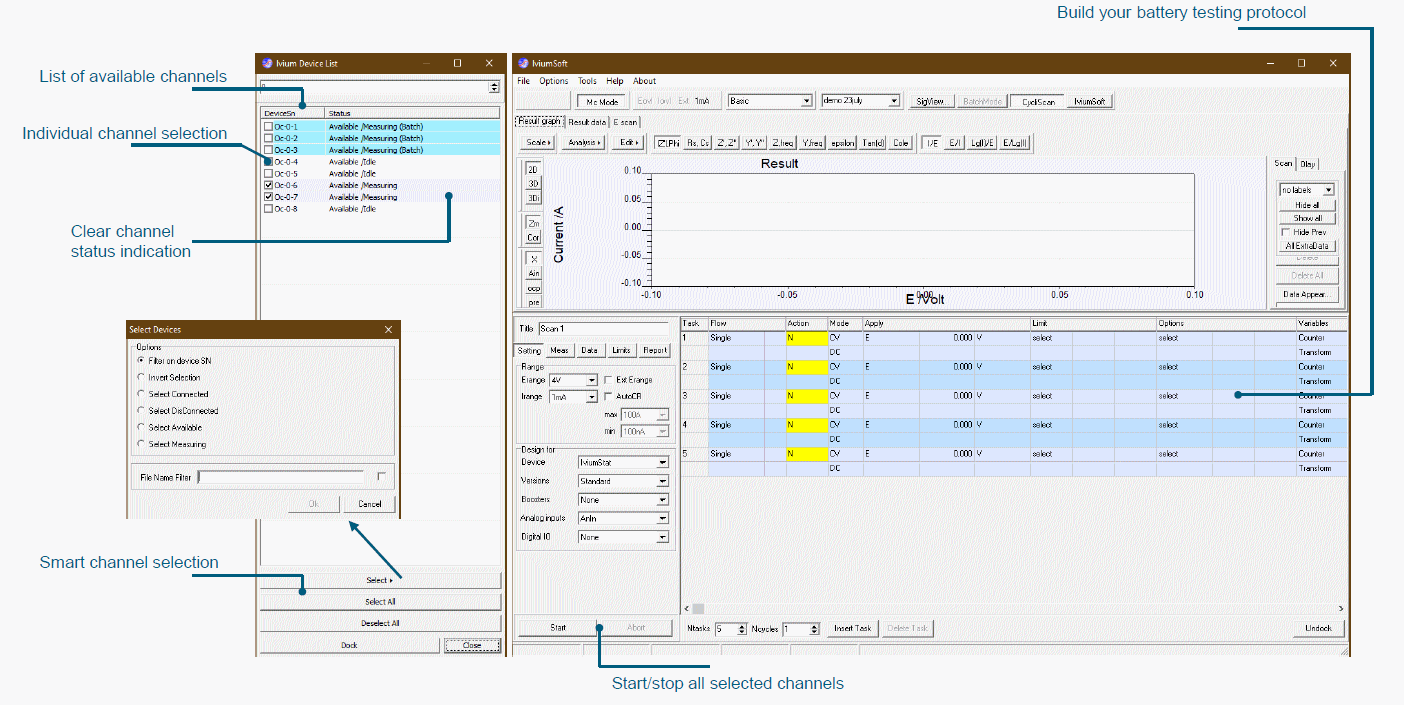
MC Mode
MC mode caters for our users who have a high-channel count system and is designed to allow no-nonsense channel management.
With parallel measurement of >100 channels, MC Mode gives a clear overview of those channels which are active, those which are grouped, and those which are available.
In addition, with a few simple clicks, the handling of these channels is fast and efficient. Ideal for the researcher with multiple cells, or the production engineer with high volumes of cells.
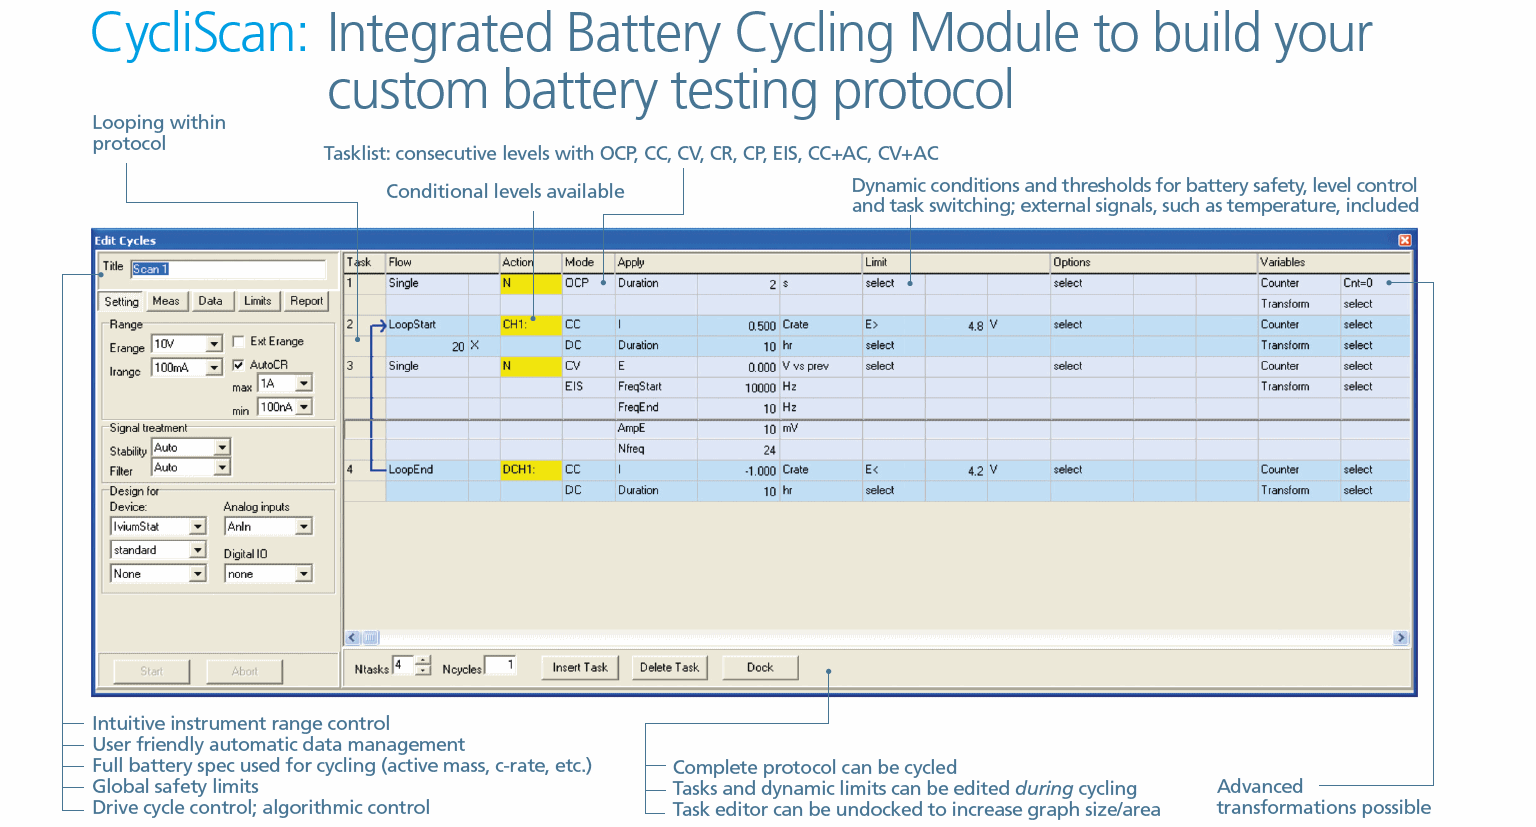
CycliScan
CycliScan is designed with the battery scientist in mind, or those who are involved in energy storage research. It is a straight-forward protocol builder that uses a linear structure, offering complete control and customization on all levels, as well as real-time.
Safety is taken care of by the global and local settings for each stage of the protocol, making the software reliable for peace-of-mind operation. Cycles can both be included in the protocol, and as an overall parameter to facilitate duration testing. For the more demanding protocols, drive cycles can either be easily imported, or simply created from the available cycle builder.
IviLAB
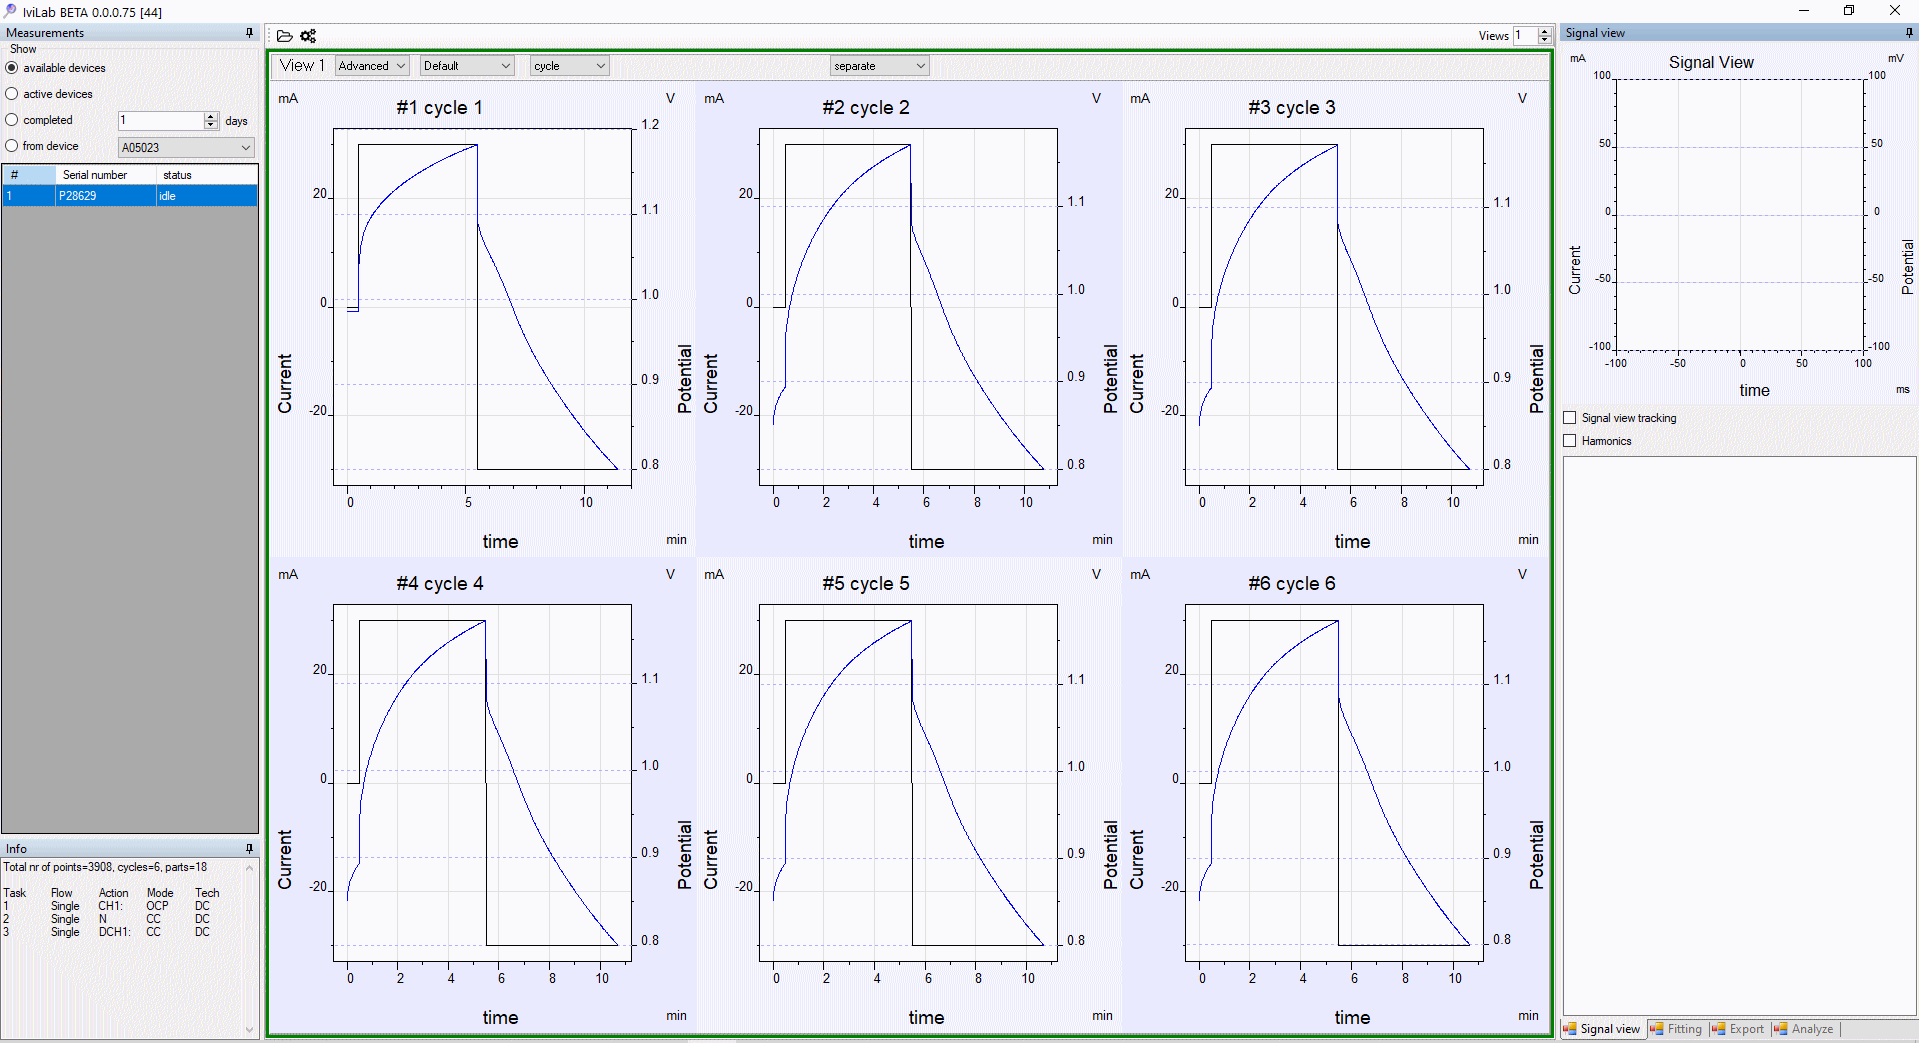
IviLAB is the perfect partner to use in combination with CycliScan and MC Mode.
It offers advanced data handling for large or multiple data sets, with a versatile approach to displaying in a manner than suits your requirements.
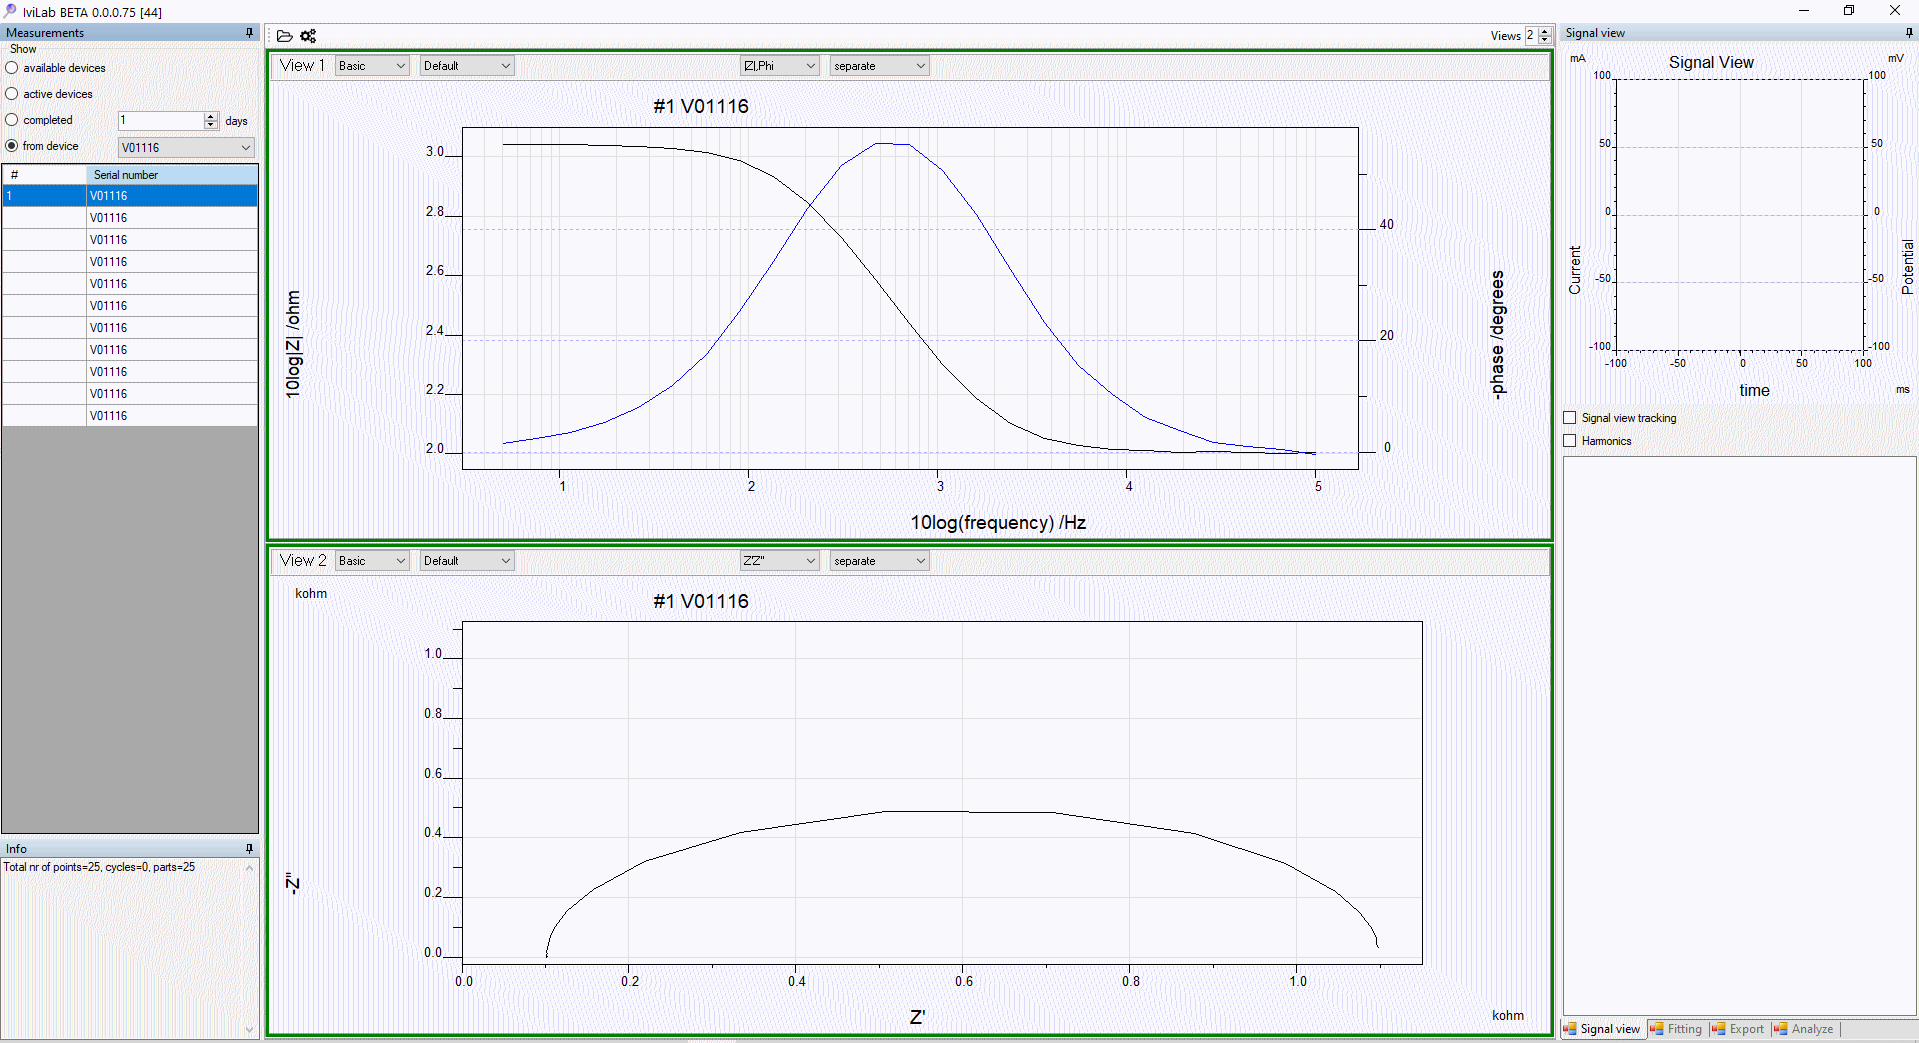
IviLAB allows the data from multiple channels to be plotted separately or on one graph, overlaying of selected cycles for direct comparison, customized graphs and representation, and an overview of all measured data in a concise and ordered format.
Charge and discharge cycling of a battery with selected cycles shown separately. The cycles can also be overlaid for ease of comparison.
Plots such as charge-discharge, capacity vs. cycle number, EIS fit, charge efficiency, and many more are possible with this powerful analysis tool.
Charge and discharge cycling of a battery with selected cycles shown separately. The cycles can also be overlaid for ease of comparison.
Multiple views of the measurements can be used to display the graph as various representations, including both the Bode and Nyquist plots shown in and EIS measurement.
